Electricity Outlook 2001: A Matter of Urgency
Charts and Diagrams
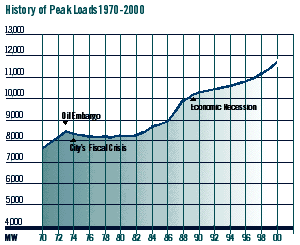
Peak load -- the moment of greatest electricity consumption in a given year -- has risen dramatically since the 1970's. The chart above shows Con Edison's peak load growth for its entire service territory, 87 percent of which falls within New York City's boundaries.
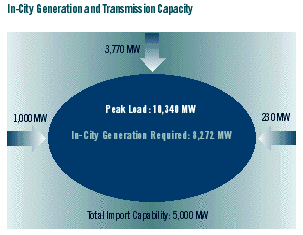
The above figure indicates the present level of demand at peak load and the amount to be generated within New York City (blue oval), and the maximum transmission capacity for importing electricity (shaded arrows).
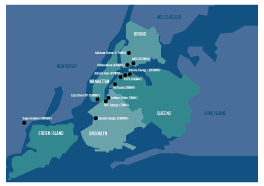
More than 5,500 MW of new generating capacity is being proposed for New York City by a number of independent generators. None of these generating plants are currently under construction. Only one application to provide an additional 288 MW is past the pre-application approval stage. This plant would not be in operation until 2002 at the earliest.
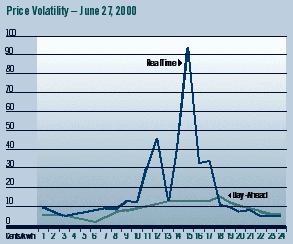
During the early afternoon hours of June 27th, 2000, the price of wholesale electricity soared -- at one point reaching 18 times the price established hours earlier or later that day. A large percentage of this spike in prices, which resulted from short supply, was passed on to consumers, who saw their June, 2000 bills jump by 43 percent from the same period a year ago.
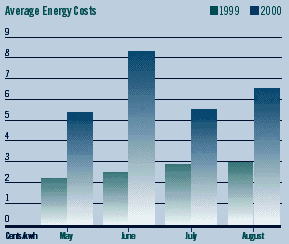
Average wholesale electricity prices more than doubled during the summer months from 1999 to 2000, causing consumer electric bills to rise sharply.


