After 2009 declines, new york city construction costs are increasing again
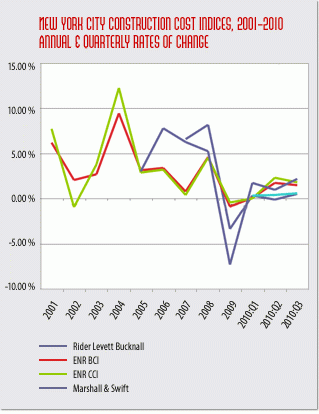
After falling in 2009, New York City construction costs have increased modestly in 2010, according to a New York Building Congress review of multiple cost indices.
Given the lack of uniformity among various cost measurements, it is not possible to pinpoint the exact level of increases; however, the indices examined have found increases in local construction costs ranging from .8 percent to 4.9 percent through the first three quarters of 2010. For comparison, the indices show an increase nationwide of between .1 percent and 7.2 percent.
While the recent slowdown in construction activity has likely lessened some inflationary pressure, the effect only goes so far given that construction spending in New York remains above $20 billion a year. While the data does not break down labor costs as a separate unit, it also appears that recent increases have been driven more by changes in volatile commodity prices, such as diesel fuel, copper, aluminum and steel, than by wage increases.
"The good news is that New York City is in no way experiencing the relentless rate of cost escalation experienced during the building boom," said New York Building Congress President Richard T. Anderson. "The bad news is that, depending upon which index you use, New York has given back most if not all of the cost declines we experienced in 2009."
Mr. Anderson continued, "While everyone recognizes that rising construction costs are often a function of global factors out of the City's control, there are measures in the areas of land use, procurement, operations and workforce management and recruitment that can be adopted by government and the construction industry to achieve tangible cost savings. One example is the recent series of landmark project-labor agreements negotiated by the Building Trades Employers' Association and the Building & Construction Trades Council, which has lowered labor costs on some major projects."
Recent Cost Surveys
The Building Congress reviewed a series of surveys in its analysis. Each survey estimates the percentage change in overall construction costs quarterly. The percentage increase or decrease represents the change from the start of each quarter to the next.
To follow is a brief summary of two of the surveys. Please see the attached data for a listing of all five surveys reviewed.
- According to Engineering-News Record's (ENR) Building Cost Index (BCI), construction costs in New York City have risen by 3.3 percent in 2010, after a .9 percent decline in 2009. This increase compares favorably to the rest of the nation, where construction costs have increased by 5.6 percent over the same period of time.
ENR uses local prices for Portland cement and lumber, the national price for structural steel, as well as local union wages, plus fringes, for carpenters, bricklayers and iron workers, to derive BCI.
- A separate survey of the New York metropolitan region by Rider Levett Bucknall (RLB) finds that construction costs in the area have increased by .8 percent thus far in 2010, after a 3.4 percent decline in 2009. The RLB survey examines much the same data as ENR but also includes estimates of bid price changes, including overhead and profit. Nationwide, RLB shows an increase of .1 percent in construction costs.
New York City vs. Select Cities
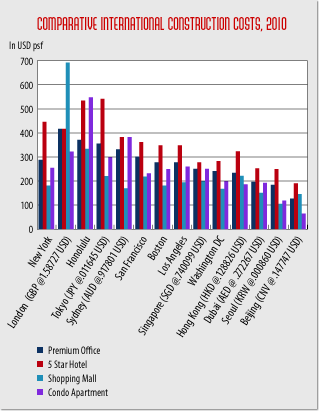
New York City fares well in overall construction costs when compared to London, its chief international rival. As of April of this year, Class A office space construction reached $288 per square foot in New York, compared to $418 psf in London.
Similarly, the cost of multi-tenant residential construction reached $209 per square foot vs. $252 per square foot in London. New York City's costs also are lower, overall, than Tokyo and Sydney, though higher than most major Asian cities, including Beijing, Seoul and Hong Kong.
Domestically, New York City construction costs were lower than Honolulu and San Francisco in the office and residential categories as of April, and generally on par with Boston and Los Angeles, though somewhat higher than Washington DC. (Data was not available for Chicago).


